If you haven’t noticed by now, the internet can be a crowded place. Whether it is new and growing platforms like TikTok or tried and true mediums like blogging and YouTube it can feel like a daunting task to understand what traffic is coming to your website, who your audience is and how to provide that audience with content that will highlight your value.
That’s where Google Analytics (also known as GA) comes into play.
What is Google Analytics?
Google Analytics is a free tool designed to analyze website traffic. Why is that important? Understanding where your traffic is coming from, what they’re searching for and some of the characteristics of those visitors can help you to improve the value of your content and grow your site and brand.
Google Analytics can be an incredibly complex tool, for our discussion today we’ll narrow our focus on some of the most important aspects to help you contextualize what’s happening on your site.
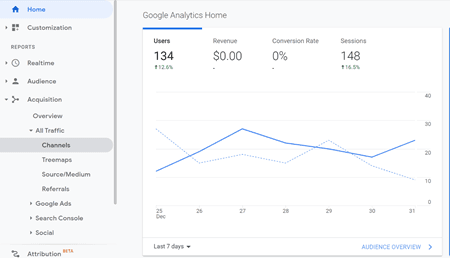
How to Use Google Analytics
Open and set up Google Analytics (GA) account
Setting up Google Analytics requires a Google account, both GA and Google accounts are free. Once you’ve registered you will need to add your website information to Google Analytics. This requires adding the Google tracking code to your site. The process for adding the code will vary depending on your web host so we will not cover it in detail here, but if you need additional guidance YouTube is usually the best go-to for visual learners also some web hosts have direct plug-ins to GA.
Ask the right questions
There is a key difference between data and information. Data is the raw numbers and measurements that you can get from a tool like GA but you want information which is the organization and structure of that data. Because you can get overwhelmed by all the data in GA you will need to come in with key questions that GA can answer. Here are a few examples:
- Where is my traffic coming from?
- What pages or posts are the most popular?
- Who is my audience and what are some of the things they are looking for?
Build reports and use filters
The reports in GA are what transform the data into information that you can use. Using the questions listed above we’ll walk through building each of these reports.
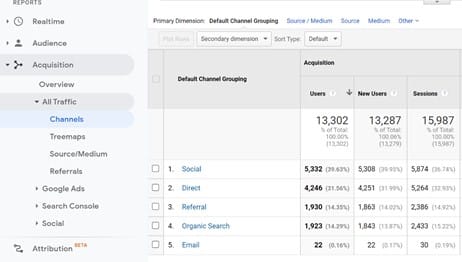
Where is my traffic coming from?
To understand where your website traffic is coming from, you’ll need to begin with the Acquisition Report. Start by going to the Acquisition tab on the left-hand side, then “All Traffic” and “Channels.”
The table that appears, shows where your traffic is coming from between social media, direct, referral, organic search, and email. In the example below, nearly 40% of the traffic comes from social media and 31% comes directly to the website. Traffic that comes via email ranks at the bottom. This information could be used in a few ways. For example, it could serve as a benchmark moving forward. If you’re focusing on building your email list you may want to track to see how the percentage of traffic changes over time.
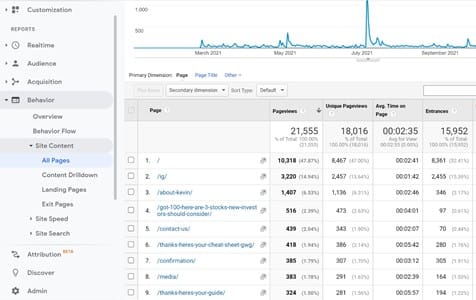
What pages or posts are the most popular?
To find out what content is the most popular, begin by clicking on the “Behavior” tab on the left-hand side. From there go to “Site Content” and “All Pages.” Each of the pages will be ranked in terms of the number of page views.
Things to note here: Pay attention to the amount of time people are staying on the page, bounce rates, and how it may overlap with the Acquisition information. These aspects can indicate which pages could be optimized, what content resonates and can be tracked as you make changes over time.
Who is my audience and what are some of the things they are looking for?
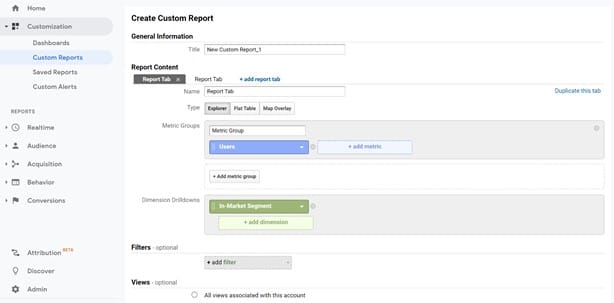
This can be answered with the psychographic report. To create this start by going to “Customization” on the left hand panel. Click “Custom Report” then “New Custom Report.” From there click the “Add Report Tab” under Report Content. This will create two separate report tabs. For the first one choose “Users” under Metric Groups and “Affinity Category” under Dimension Drilldowns.
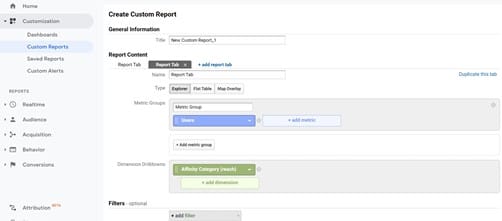
In the second tab choose “Users” and “In-Market Segment” and click Save at the bottom.
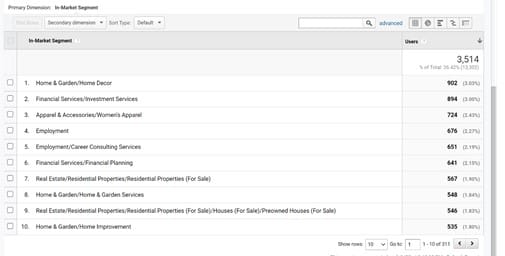
This will create a report that tells you what your website viewers are “in-market” for. These are the other areas that your audience is actively searching and shopping for. In the example below, there is an even split between Home & Garden and Financial Services/Investing Services. This conveys two things. First, it could be potential opportunities for collaborations or advertising. Second, it may reinforce that your content is right for your audience and may also reveal other content ideas.
Conclusion
Each of the three reports can provide clear and simple insights to find areas of improvement and optimization for your site. For a deeper dive into all the bells and whistles of Google Analytics, there are a number of resources out there including Google’s Analytics Academy.


0 Comments